While highlighting the channels through which tariffs – taken in isolation - impact both the economies of the imposing nation and the targeted economies, the analysis complements the baseline projections presented in this publication. Results indicate that the imposition of tariffs weakens the US economy, with moderate negative effects also on EU GDP. A general tit-for-tat retaliation deepens the negative impacts in both the US and the EU. Beyond the direct effects of tariffs, rising uncertainty and a loss of investor confidence in the US economy further aggravates the adverse economic consequences by tightening financing conditions.
This Special Topic presents model simulations of three stylised scenarios related to the sharp protectionist turn of US trade policy and potential countervailing measures. The first scenario reflects US announcements up to and including 2 April 2025, featuring sizeable unilateral tariff hikes on US imports of goods from virtually all trading partners. (23) As the long-term outlook remains uncertain, the increase in tariffs is assumed to be highly persistent, though not permanent. In a second scenario, the simulations add the effects of symmetric retaliations by other countries, amid a stylised global tit-for-tat escalation. The sweeping US tariff announcements, as well as the uncertainty regarding their application, triggered strong responses in financial markets, with investors demanding higher risk premia on dollar-denominated financial assets. (24) The third scenario therefore illustrates the impact of shifts in US risk premia, on top of the pure unilateral tariff effects. Simulations are based on DG ECFIN’s QUEST model. (25)
Unilateral US tariff hikes
While higher tariffs shift US demand from imports towards domestically produced goods, they also act as an adverse supply shock. Tariffs are a tax on imports that make foreign goods more expensive for US households and firms. This induces some substitution away from imports towards US-produced goods (expenditure switching channel), which boosts US aggregate demand. (26) At the same time, tariffs erode the purchasing power of wages, which lowers labour supply. (27) Moreover, through taxing imported intermediate inputs, tariffs raise domestic production costs, acting as a further adverse supply shock.
US terms-of-trade appreciation dampens the effect of tariffs on relative prices. Excess demand for domestic products puts a strain on the economy’s resources, leading to a 5.6% appreciation in the US terms-of-trade (ToT), (28) which is reflected partly in higher domestic inflationary pressures, and partly in a stronger nominal exchange rate for the US dollar (induced by monetary tightening in response to higher inflation). (29) The stronger ToT offsets roughly one third of the direct effect of tariffs on relative prices, and acts as an equilibrating force to bring demand for US goods back in line with supply capacities.
The US economy is hurt by the tariffs, as falling exports and weaker domestic demand drive GDP 0.6-1.0% lower (top left panel of Graph II.1.1). A stronger real exchange rate, in addition to limiting the shift away from imports, also makes US exporters less competitive abroad, thereby crowding out exports (expenditure switching channel). In addition, higher real interest rates, as monetary policy reacts to higher inflation, reduce domestic demand for investment and consumption (intertemporal substitution channel). (30) At the same time, however, the terms-of-trade gain from a stronger dollar provides some cushion for the fall in consumption demand, as it raises the purchasing power of domestic incomes (real income channel).
| Graph II.1.1: Unilateral US tariffs on imports |
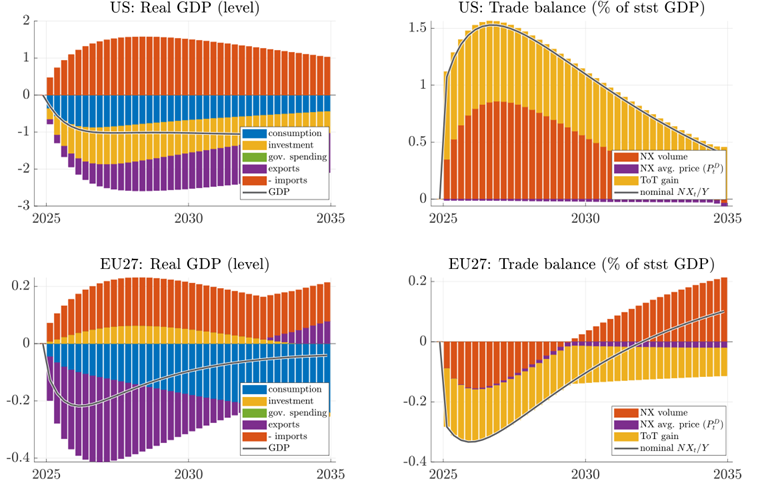 |
| Notes: The panels on the left report real GDP in %-deviation from baseline, with the contribution of expenditure components to GDP. The panels on the right show the respective trade balance-to-GDP ratios (in pp-deviation from baseline), showing contributions by volumes, average price level change and terms-of-trade (relative price) changes. NX (ToT) refers to net exports (terms-of-trade). |
Tariffs reduce US trade deficits only temporarily, by 1.3-1.5% of GDP. While tariffs shift the composition of demand from imports towards US-produced goods, the resulting terms-of-trade appreciation crowds out exports, in order to bring demand for US goods back in line with supply capacities. Therefore, the tariff hike reduces gross trade flows, lowering both imports and exports. (31) That said, initially, import volumes decline more (by 6-11%) than export volumes (by 2-6%), implying a positive contribution to the trade balance (see top right panel of Graph II.1.1). On top of the volume component, the terms-of-trade gain raises the nominal trade balance further, as it reduces the import bill and boosts export revenues through changes in relative prices. (32) However, in the medium run, these effects fade as the fundamental drivers behind the US external balance – saving relative to investment – are not significantly affected.
EU GDP would be lowered moderately, by around 0.2%, driven mainly by weaker exports (bottom left panel of Graph II.1.1). The exports of the EU initially decrease by 1.1-1.5% (see Table II.1.1). Since the US is one of the EU’s largest export markets, EU exports suffer from the shrinking American market size, as US firms and households respond to tariffs by importing less overall, including from Europe (see yellow bars in top left panel of Graph II.1.2). However, this effect is somewhat mitigated via two channels. First, EU exporters gain market share in third countries at the expense of American exporters who become less competitive due to a stronger dollar and more costly imported inputs (see purple bars). Second, they would also gain market share in the US, at the expense of Chinese exporters who are targeted with asymmetrically higher tariffs. At the same time, this asymmetry also implies a larger ToT depreciation for China than for the EU, eroding the competitiveness of EU exporters in the Chinese market (see red bars), and slightly raising EU imports from China (blue bars in the top right panel). Graph II.1.2 also highlights the importance of exposure to the US market: despite a similar rise in tariff rates, the decline in US-bound exports is significantly smaller for the EU than for Mexico or Canada, who are more reliant on the US as an export destination.
| Graph II.1.2: Export decomposition (unilateral US tariffs on imports) |
 |
| Notes: Export volumes are reported in %-deviation from baseline, with the contribution of various destination markets. |
The EU’s trade balance would decline by about 0.3% of GDP (see bottom right panel of Graph II.1.1). The flipside of a stronger dollar is a weaker (more competitive) real effective exchange rate for Europe. This does not only cushion the fall in EU exports (as discussed above), but also reins in European import demand, inducing substitution towards domestically produced goods that mitigates the fall in GDP and in the volume component of the trade balance. That said, this volume component is still negative as exports initially decline more than imports.
| Table II.1.1: Unilateral persistent US tariffs on imports |
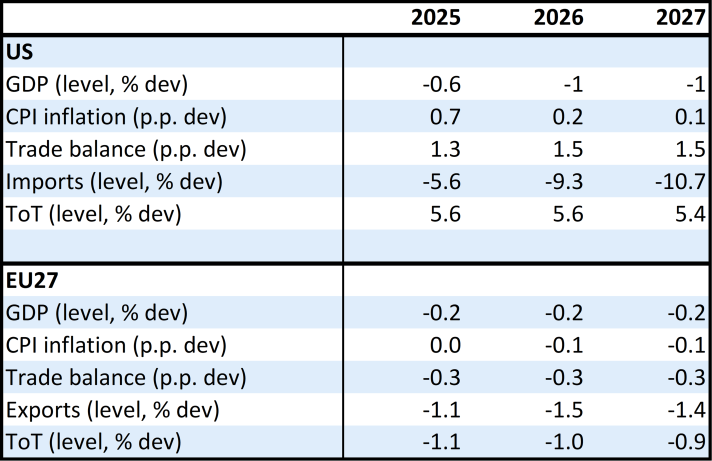 |
| Notes: Aggregated results for annual frequency. Deviations relative to a scenario without tariffs. |
The terms-of-trade loss makes the EU poorer. A depreciating terms-of-trade lowers the trade balance beyond the negative volume contribution and erodes the purchasing power of European incomes beyond the fall in real GDP, lowering real gross disposable income (rGDI) by 0.4% (see Graph II.1.3). (33) This real income loss also weighs on EU consumption demand.
Inflation in the EU is likely to decline only mildly. Recessionary forces lower domestic inflationary pressures in Europe, but the exchange rate depreciation in this scenario partly counteracts this effect via rising import prices. Responding to lower inflation and slower growth, monetary easing in Europe would provide some support to domestic demand.
Symmetric retaliation by all US trade partners
Retaliation by the EU and all other trading partners would be harmful for GDP in the US, the EU and the rest of the world. The general result that tariffs hurt the economy of the country that implements them applies also to retaliatory tariffs. In an alternative scenario, illustrating a hypothetical “trade war”, we simulate symmetric retaliations by all trading partners on imports from the US (see dashed lines in Graph II.1.3). In addition to deepening US GDP losses relative to our central scenario (solid lines), retaliation also raises European GDP losses further, to 0.3-0.4% – despite mitigating the fall in the EU’s trade balance. At the same time, Europe’s ToT-loss gets eliminated, so the EU’s real gross disposable income (rGDI) declines somewhat less in this scenario. In contrast, by undoing the original ToT-gain of the US, together with deepening the GDP losses, coordinated global retaliations hurt American rGDI markedly. The effects on the US economy are larger, given that the tariffs affect the entirety of American trade flows, while for other countries they are levied only on their trade with the US.
| Graph II.1.3: Macroeconomic effects on the EU and the US under unilateral tariffs and retaliations. |
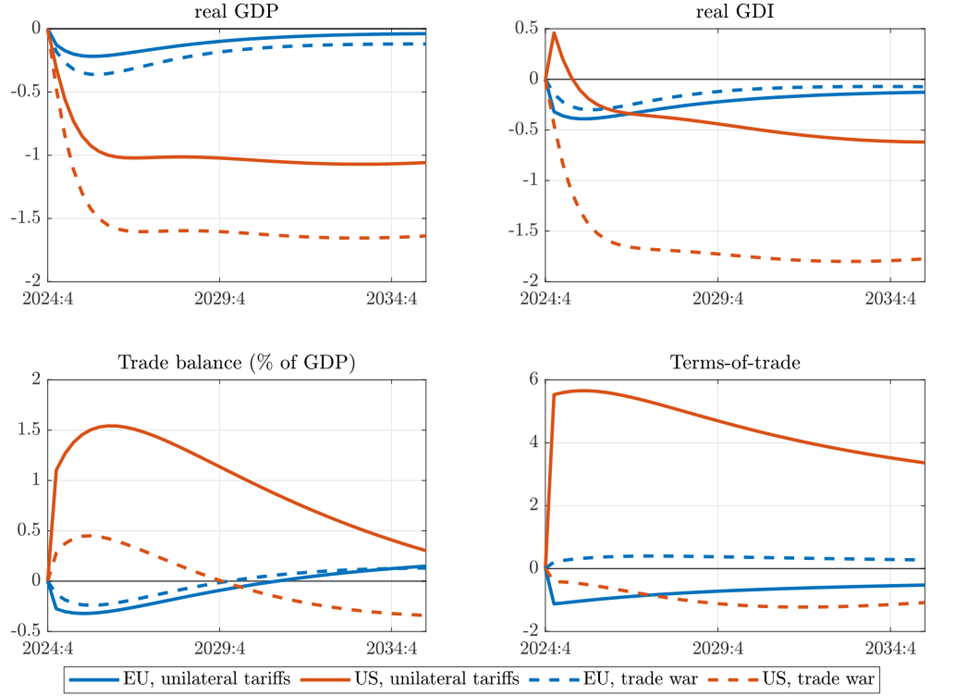 |
| Notes: The macroeconomic effects on the EU (blue) and the US (red) of unilateral US import tariffs (solid lines), with potential symmetric retaliation from trading partners on imports from the US (“trade war” scenario, dashed lines). Tariff hikes are persistent (with quarterly AR1 coefficient of 0.975). Unless indicated, lines depict %-deviation of levels from no-tariff baseline. Real GDI refers to real gross disposable income, which is real GDP complemented with the terms-of-trade gain. |
These stylised simulations only cover selected channels of the tariff hikes. One important caveat for the interpretation of the results is that the model simulations do not consider productivity losses stemming from the lower exploitation of comparative advantages amid a more fragmented global trade landscape and reduced gross trade flows. This channel could exacerbate the negative economic consequences further. (34) In addition, while our macroeconomic model suggests moderate aggregate effects on the EU, the impacts on specific Member States and economic sectors could differ substantially.
Uncertainty and confidence shocks
A loss of confidence in the US economy and rising uncertainty further aggravate the adverse economic consequences. The above model simulations, which only consider the direct effect of tariffs, do not account for additional negative confidence effects, the extreme rise in global trade uncertainty, or expectations about adverse productivity effects in the US – all of which may hold back investment decisions and tighten financing conditions. The reaction of financial markets following the 2 April announcement (e.g. the unusual combination of a falling dollar and rising US Treasury yields) seems to indicate such forces are highly relevant in the current context.
To qualitatively illustrate the implications of these additional channels, we simulate a stylised increase in the risk premium on USD denominated assets and US capital investments, on top of the unilateral US tariff hikes discussed above. In the absence of a comparable precedent, precise quantification is not feasible at this stage, so the exercise is purely illustrative.
| Graph II.1.4: Macroeconomic effects on the EU and the US with unilateral tariff and risk premium shocks. |
 |
| Note: The macroeconomic effects on the EU (blue) and the US (red) of unilateral US import tariff hikes only (solid lines), with additional illustrative risk premium shocks on US financial assets and capital (dashed lines). Tariff hikes are persistent (with quarterly AR1 coefficient of 0.975. Unless indicated, lines depict %-deviation of levels from no-tariff baseline. Real GDI refers to real gross disposable income, which is real GDP complemented with the terms-of-trade gain. |
Higher risk premia on US assets raise interest rates further and induce a dollar depreciation. In recent weeks, such USD depreciation has more than offset the appreciation pressure that would be implied by unilateral US tariff hikes alone. However, as shown in Graph II.1.4, despite a weaker nominal dollar, the US real exchange rate (and terms-of-trade) is still expected to strengthen over time, only more gradually. While the more gradual terms-of-trade appreciation supports US net export volumes relative to a pure tariff shock, the higher interest rates induced by rising risk premiums dampen domestic capital accumulation and consumption demand – on balance deepening the decline in US GDP. Moreover, the smaller terms-of-trade gain lowers real gross disposable income even further. Therefore, although the US trade balance rises more in this scenario (due to both a more competitive terms-of-trade as well as lower domestic spending), it happens amid a more recessionary economic landscape.
For the EU, the consequences of the additional risk premium shocks are more contained, as long as the loss of confidence concerns primarily the US (as assumed here). The stronger euro weighs on the trade balance, but at the same time, investments also become relatively more attractive in Europe, leaving the GDP response similar.
Footnotes
([23]) The effective bilateral tariff rates used in our simulations are calculated based on the following set of assumptions: a general increase of 25 percentage points (pps) on goods imported from Mexico and Canada, with only 10pp on oil imports from Canada, and with USMCA-compliant imports (assumed to be 40% of total imports) being fully exempted; 54 pps on goods imports from China, 20 pps on goods from the EU, and 23 pps on average from the rest of the world. These country-specific headline rates are fine-tuned by sectoral tariff hikes of 25 pps in the case of aluminium, steel and automobile imports. For other sectors that are temporarily exempted (e.g. pharmaceuticals and semiconductors) we assumed the country-specific headline rate would apply. Trade in services is taxed at 0%. As a result, the effective tariff rate on total US imports (including services) goes up by around 20 pps.
([24]) See, e.g., Jiang et al. (2025) “Dollar Upheaval: This Time is Different”, mimeo (16 April 2025).
([25]) QUEST is a New Keynesian open economy dynamic stochastic general equilibrium (DSGE) model. The model framework includes the main features relevant for understanding tariffs, such as imperfect substitutability of goods produced in different regions, and sluggish adjustment of import volumes in response to relative price changes. Trade flows and nominal exchange rates are modelled bilaterally, via integrated international goods and capital markets. The dynamic model structure enables us to trace both short and long-run effects. The model distinguishes between a tradable and a non-tradable sector. While it lacks the sectoral detail of typical trade Computable General Equilibrium (CGE) models and therefore cannot assess impacts on specific manufacturing sectors and services, it includes trade in intermediate inputs for both the tradable and non-tradable sectors. This captures linkages through cross-border value chains, which is crucial as trade in intermediate inputs amplifies the effects of trade barriers. For these simulations, we use a 6-region version of the model, including the EU, US, China, Canada, Mexico and the rest of the world (RoW), with trade linkages calibrated based on the FIGARO database.
([26]) This demand-boosting effect of tariffs is partially weakened in our model by several channels: a) substitution between imports and domestic goods is sluggish in the short run; b) with liquidity-constrained households, as tariffs erode the purchasing power of incomes, this weakens demand not just for imports but also for domestically produced goods (real income channel).
([27]) This reflects the substitution effect from lower real wages, reducing labour supply as leisure becomes relatively cheaper. In the case of tariffs, the opposing income effect from lower real wages – which would typically increase labour supply, as poorer households can afford less leisure – is offset for unconstrained households by an income boost from higher expected net government transfers, funded by tariff revenues.
([28]) The terms-of-trade (ToT) is the ratio of export prices to import prices (at the border, expressed in the same currency), capturing the relative price of domestically produced and foreign-produced goods. In other words, it shows how much a country can import in exchange for its exports (with a higher ToT making a country richer), but also how expensive its exporters are in world markets (with higher/stronger ToT hurting competitiveness). The ToT is a kind of real effective exchange rate measure, and depends on nominal exchange rates as well as on domestic and foreign price levels. While in the medium term, monetary policy has less control over the real exchange rate itself, it can influence to what extent a given real appreciation pressure is reflected in stronger nominal exchange rates or relatively higher domestic inflation.
([29]) To a smaller extent, weakened US import demand also puts downward pressure on the export prices of US trading partners, which contributes somewhat to the US terms-of-trade appreciation.
([30]) As the tariff shock is assumed to be non-permanent, tariffs act as an intertemporal tax, encouraging the postponement of consumption, and deepening the negative intertemporal substitution effects.
([31]) This is a (partial) manifestation of the Lerner symmetry, which points out that a tax on imports behaves similarly to a tax on exports.
([32]) The higher current account balance is also a reflection of a temporarily higher saving-investment differential in the US, stemming from lower domestic demand (i.e. spending falling more than national income). This can also be broken down as higher government budget balances, driven by tariff revenues of around 2.0-2.5% of GDP (while the net lending balance of the private sector initially declines by a smaller amount).
([33]) Real gross disposable income (rGDI) expresses the value of an economy’s output in terms of its domestic spending (i.e. private and public consumption and investment). In other words, it reflects the purchasing power of the incomes earned from domestic production. rGDI is equal to the sum of real GDP and the terms-of-trade gain.
([34]) While the model distinguishes between traded goods produced in different regions, it does not single out commodities in general. Therefore, the effects of specific commodity price movements observed recently might not be captured entirely.